Mastering Supply and Demand Trading Strategy
A comprehensive guide to understanding and implementing supply and demand trading
1. Introduction to Supply and Demand
What is Supply and Demand Trading?
Supply and Demand trading is a simple way to trade based on where big buyers and sellers are active in the market. It helps you find important price levels where the market is likely to turn around. These areas show us where big players (like banks and institutions) are buying or selling.
Main Parts of Supply and Demand
- •Order Flow:
Understanding how big trades affect price movement in the market.
- •Price Moves:
Finding areas where price moves quickly because of big buyers or sellers.
- •Market Structure:
Looking at longer time charts to understand the bigger picture.
How Markets Work
Big Players in the Market
- •Big Orders:
Banks and big traders buy and sell at certain price levels, causing price changes.
- •Price Movement:
Prices move up and down as they test different levels.
- •Market Control:
Understanding how big players control price movement.
What Makes Good Trading Zones
Selling Zones (Supply)
- •Price drops quickly after reaching this area
- •Price moves smoothly without stopping much
- •Clear price movement with few spikes
- •Usually comes after price goes up a lot
- •Stronger if seen on bigger time charts
Buying Zones (Demand)
- •Price jumps up quickly from this area
- •Price bounces back fast
- •More trading happens in this area
- •Usually comes after price drops a lot
- •Price stays above this area after bouncing
2. Core Principles
Fundamental Concepts
Price Imbalance
Markets move when there's an imbalance between buyers and sellers. Key aspects include:
- Volume divergence
- Price velocity changes
- Order flow dominance
- Institutional positioning
Liquidity Pools
Areas where large volumes of orders concentrate:
- Stop loss clusters
- Limit order accumulation
- Psychological price levels
- Historical swing points
Market Memory
Price tends to respect historical zones:
- Previous reaction points
- Institutional interest areas
- Major support/resistance
- Volume profile nodes
Advanced Trading Principles
Price Action Patterns
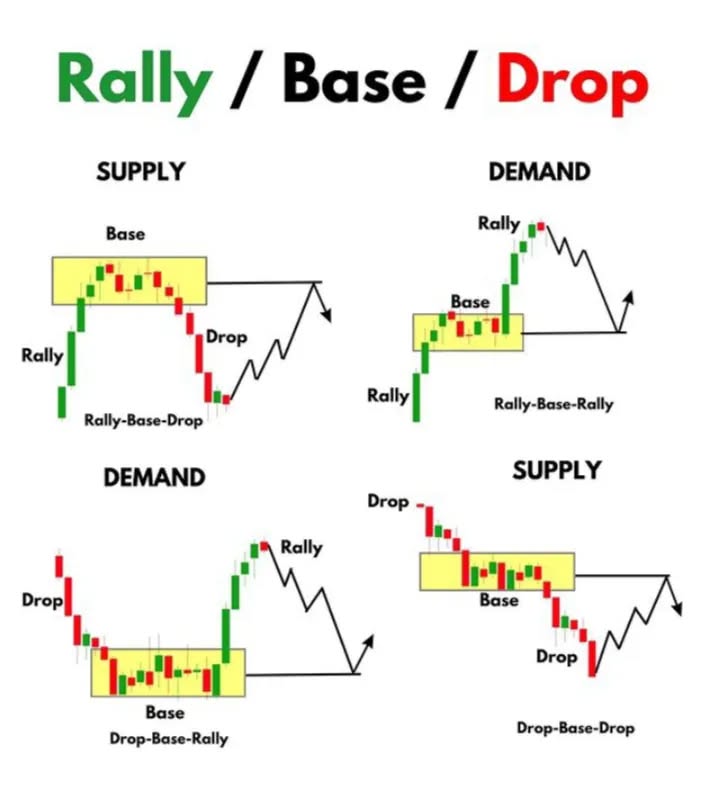
Supply and Demand patterns: Rally-Base-Drop, Rally-Base-Rally, Drop-Base-Rally, and Drop-Base-Drop
Rally-Base-Drop (RBD)
A pattern showing where big sellers enter the market:
- Rally: Strong upward price movement showing buyer control
- Base: Price consolidation in a tight range, forming the supply zone
- Drop: Sharp decline showing sellers taking control
Rally-Base-Rally (RBR)
A pattern showing strong buying pressure resuming after consolidation:
- First Rally: Initial upward movement showing buyer interest
- Base: Sideways consolidation forming the demand zone
- Second Rally: Strong continuation of upward movement
Drop-Base-Rally (DBR)
A pattern showing where big buyers enter after a decline:
- Drop: Sharp decline showing seller exhaustion
- Base: Price consolidation forming the demand zone
- Rally: Strong upward movement as buyers take control
Drop-Base-Drop (DBD)
A pattern showing continued selling pressure after consolidation:
- First Drop: Initial downward movement showing seller control
- Base: Sideways consolidation forming the supply zone
- Second Drop: Continuation of downward movement
Market Context Analysis
Trend Structure
- Higher highs and higher lows (Uptrend)
- Lower highs and lower lows (Downtrend)
- Equal highs and lows (Range)
Market Phases
- Accumulation phase
- Mark-up phase
- Distribution phase
- Mark-down phase
Zone Validation Criteria
| Criteria | Strong Zone | Weak Zone |
|---|---|---|
| Price Movement | Sharp, decisive movement | Gradual, hesitant movement |
| Candle Structure | Clean candles, minimal wicks | Many wicks, overlapping candles |
| Volume | High volume, clear imbalance | Average or low volume |
| Time in Zone | Quick departure from zone | Extended consolidation |
| Previous Tests | No or few previous tests | Multiple previous tests |
3. Identifying Supply and Demand Zones
Identification Process
Candle Pattern Recognition
- •Look for impulsive moves with large, decisive candles
- •Identify areas of rapid price change
- •Mark zones where price moved quickly without much consolidation
Zone Drawing Techniques
- •Draw from the body of the first candle that creates the imbalance
- •Extend the zone to include wicks of surrounding candles
- •Typically 2-5 candles wide for most markets
Visual Identification Criteria
Demand Zone Indicators
- ↗Sharp upward movement
- ↗Buying pressure overwhelming sellers
- ↗Price leaves the zone quickly
Supply Zone Indicators
- ↘Sharp downward movement
- ↘Selling pressure overwhelming buyers
- ↘Price leaves the zone quickly
When to Use Supply vs Demand Zones
When to Use Supply Zones (For Selling)
Market Signs to Look For
- Price has gone up a lot and is now reaching the supply zone
- The overall market is going down or at a strong resistance level
- Bigger time charts show downward movement
- This supply zone worked well before
Signs the Zone is Working
- Price starts making red candles (showing sellers are strong)
- More people are selling (you see more trading activity)
- Price is having trouble going higher (making equal highs)
- Price movement becomes slower, showing buyers are getting weaker
Real Example
Let&s say Bitcoin has gone up $5,000 in two days and is now at $48,000. Last time it was here, it dropped $3,000. You notice:
- Price is moving up slower than before
- More red candles are appearing
- Price keeps trying but can't go above $48,000
- Daily and 4-hour charts both show this is an important level
This looks like a good place to sell because the market is showing weakness.
When to Use Demand Zones (For Buying)
Market Signs to Look For
- Price has dropped a lot and is now reaching the demand zone
- The overall market is going up or at a strong support level
- Bigger time charts show upward movement
- This demand zone worked well before
Signs the Zone is Working
- Price starts making green candles (showing buyers are strong)
- More people are buying (you see more trading activity)
- Price is bouncing off the lows (making higher lows)
- Price starts moving faster upward, showing sellers are getting weaker
Real Example
Let's say EUR/USD has dropped 100 pips in one day and is now at 1.0850. Last time it was here, it went up 50 pips. You notice:
- Price is falling slower than before
- More green candles are starting to appear
- Price is making higher lows at 1.0850
- Both daily and 4-hour charts show this is a strong buying level
This looks like a good place to buy because the market is showing strength.
Advanced Usage Considerations
Zone Strength Assessment
- Fresh zones (never tested) are typically strongest
- First retest of a zone has highest probability
- Multiple tests weaken zone effectiveness
- Higher timeframe zones carry more weight
Market Phase Considerations
- Trending market: Focus on zones in trend direction
- Ranging market: Trade both supply and demand zones
- Choppy market: Wait for clear zone validation
- High volatility: Widen zone boundaries
Risk Management Rules
- Always place stops beyond the zone
- Consider volatility when setting zone boundaries
- Use time-based exits if price stalls in zone
- Scale out of positions at major levels
4. Looking at Different Time Charts (Multi-Timeframe Analysis)
Why Look at Different Time Charts?
Looking at different time charts is like zooming in and out on a map. The bigger picture helps you see where the market is really going, while shorter time charts help you find the perfect entry point.
Big Picture Charts (Weekly/Daily)
- •Shows the main market direction
- •Finds major buying and selling zones
- •Shows where big players are active
Middle Charts (4H/1H)
- •Confirms zones from bigger charts
- •Shows current market swings
- •Helps time your entries better
Close-Up Charts (15M/5M)
- •Shows exact entry points
- •Helps place precise stops
- •Shows immediate price action
Step-by-Step Guide to Multi-Timeframe Analysis
Step 1: Start with the Big Picture (Weekly/Daily)
- Open the weekly chart first
- Look for major trend direction (up, down, or sideways)
- Mark major supply and demand zones
- Note any big price levels that caused reversals
- Move to the daily chart
- Confirm the trend you saw on weekly
- Mark important daily zones
- Look for any pattern forming
Step 2: Check the Middle View (4H/1H)
- Study the 4-hour chart
- Look for zones that match with bigger timeframes
- Check current market momentum
- Find potential entry areas
- Analyze the 1-hour chart
- Look for clear price swings
- Find recent supply and demand zones
- Start planning your trade
Step 3: Fine-Tune Entry (15M/5M)
- Watch the 15-minute chart
- Look for entry signals
- Watch how price reacts at your zones
- Find good stop loss levels
- Use 5-minute for precision
- Time your entry perfectly
- Place precise stop loss
- Watch initial price reaction
Real Trading Example
EUR/USD Trading Setup
Weekly/Daily Analysis
Weekly chart shows uptrend with major demand zone at 1.0800. Daily chart confirms this zone with three previous bounces.
4H/1H Confirmation
4H shows price approaching the zone with slowing downward momentum. 1H shows small demand zones forming within the bigger zone.
15M/5M Entry
15M shows bullish signals forming at 1.0805. 5M confirms entry with strong green candle and clear stop below 1.0795.
Common Mistakes to Avoid
What Not to Do
- ✗Don't skip the bigger timeframes
- ✗Don't trade against the bigger trend
- ✗Don't focus only on small timeframes
- ✗Don't ignore conflicting signals between timeframes
Best Practices
- ✓Always start with weekly/daily charts
- ✓Look for agreement between timeframes
- ✓Use smaller timeframes only for entry
- ✓Keep notes of what you see on each timeframe
5. Entry Strategies
Getting into a trade at the right time is just as important as finding the right zone. A good entry helps you minimize risk and maximize potential profit. Here are the main ways to enter trades, along with detailed guidelines for each.
Types of Entries
1. Limit Entry (Waiting Entry)
Place your order before price reaches the zone and wait for it to trigger.
When to Use
- When you have a clear zone with strong history
- When you can't watch the market all day
- When you want to get the best possible price
How to Do It
- Place buy orders at the top of demand zones
- Place sell orders at the bottom of supply zones
- Set stop loss beyond the zone
- Have take profit orders ready
2. Confirmation Entry (Active Entry)
Wait for price to show signs of reversal in your zone before entering.
When to Use
- When you want more confirmation
- When you can actively watch the market
- When the zone is being tested for the first time
How to Do It
- Wait for price to enter the zone
- Look for reversal candles
- Check for increasing trading volume
- Enter when price starts moving in your direction
Entry Techniques
Single Entry
Enter with full position size at once
Best For
- Strong, clear zones
- When you have clear confirmation
- Smaller position sizes
Scaled Entry
Enter in multiple parts as price moves
Best For
- Wider zones
- Larger position sizes
- When unsure of exact reversal point
Break Entry
Enter when price breaks out of the zone
Best For
- Strong trend continuation
- When zone gets broken
- More aggressive trading style
Complete Entry Checklist
Use this checklist before every trade. Each item has detailed examples to help you make better trading decisions. Click "Show example" on each item to see specific scenarios and numbers.
Trade Entry Checklist
0 of 18 items verified
Market Direction
Zone Quality
Target Setting
Entry Setup
Risk Management
Final Checks
Example 1: Day Trading Setup (1 trade per day)
EUR/USD trade at London open:
• Weekly trend is up (checked on Sunday)
• Found demand zone at 1.0800-1.0820
• Wait for London open (8 AM GMT)
• Enter when price hits zone with green candle
• Stop loss at 1.0780 (below zone)
• Target 1.0860 (2x risk)
• Close trade before New York close
Example 2: Swing Trading Setup (holding for days)
Bitcoin swing trade:
• Weekly trend is down
• Supply zone found at $48,000-$48,500
• Price approaching slowly over days
• Enter short when red candles appear
• Stop loss at $49,000 (above zone)
• First target $47,000 (2x risk)
• Second target $46,000 (3x risk)
• Hold for several days if needed
Entry Confirmation Signs
Price Action Signs
- •Reversal Candles:
Look for strong candles showing price rejection (long wicks, strong bodies)
- •Price Momentum:
Watch how quickly price moves in your expected direction
- •Multiple Timeframe Agreement:
Check if smaller timeframes show the same reversal signs
Volume Signs
- •Trading Activity:
Look for increased trading volume in your expected direction
- •Volume vs Price:
Check if volume increases as price moves in your favor
- •Volume Patterns:
Watch for declining volume on moves against your direction
Real Entry Examples
Example 1: Limit Entry at Demand Zone
EUR/USD has a strong demand zone between 1.0800-1.0820. Here's how to enter:
- Place buy limit order at 1.0815 (upper part of zone)
- Set stop loss at 1.0790 (below the zone)
- First target at 1.0865 (previous resistance)
- Second target at 1.0900 (round number)
Example 2: Confirmation Entry at Supply Zone
Bitcoin supply zone at $48,000-$48,500. Here's the entry process:
- Wait for price to enter zone ($48,200)
- Look for red candles showing seller strength
- Enter short when price starts dropping with volume
- Stop loss above zone at $48,700
- Targets at $47,500 and $47,000
Entry Rules Checklist
Entry Don'ts
- ✗Don't enter without checking bigger timeframes
- ✗Don't chase price if you miss the entry
- ✗Don't enter without a clear stop loss level
- ✗Don't risk more than planned just to enter
Entry Do's
- ✓Always have your exit plan ready before entering
- ✓Check multiple timeframes for confirmation
- ✓Wait for clear signs before entering
- ✓Calculate position size before placing orders
6. Protecting Your Money
Risk and Reward
Smallest Win vs Loss
1:2
For every $1 you might lose, aim to make $2:
- When you're very sure about the trade
- When many signs point to success
- When the market is moving clearly
Best Win vs Loss
1:3 or 1:4
For every $1 risk, try to make $3-4:
- When price is moving strongly
- When all time charts agree
- When big players are active
Most You Can Risk
1-2%
How much to risk per trade:
- 1% for normal trades
- 2% only for perfect setups
- Be careful with similar trades
How Much to Trade
Position Size Calculator
Calculation Results
Always verify calculations and adjust position size based on market conditions and your risk tolerance.
Trade Size Math
Trade Size = (Your Money × Risk %) ÷ (Entry - Stop Loss) × Tick ValueWhat You Need:
- Your Money: How much you have to trade
- Risk %: 1-2% of your money
- Entry: Where you buy/sell
- Stop Loss: Where you'll exit if wrong
- Tick Value: How much each price move is worth
Changing Trade Size
Market Movement
- Trade less when market is jumpy
- Use price swings for stop loss
- Think about trading costs
Your Account
- Trade less after losses
- Be careful after winning a lot
- Watch out for similar trades
Stop Loss Strategies
Technical Stop Loss
- •Place beyond supply/demand zone
- •Consider market structure
- •Account for volatility (ATR)
Time-Based Stop Loss
- •Exit if no movement in X bars
- •Consider session boundaries
- •News event protection
Volatility Stop Loss
- •ATR-based placement
- •Dynamic adjustment
- •Market phase consideration
Risk Management Rules
- 1
Daily Loss Limit
Stop trading after 3% account loss in a day
- 2
Weekly Risk Cap
Maximum 6% account risk per week
- 3
Correlation Management
Maximum 2 correlated trades at once
- 4
Drawdown Protocol
Reduce position size by 50% after 10% drawdown
7. Trade Management
Trade Progression Stages
1. Entry Management
Initial Entry Confirmation
- Price action confirmation (candlestick patterns)
- Volume confirmation at entry
- Market structure alignment
- Multiple timeframe confluence
Entry Types
- Single entry (full position)
- Scaled entry (partial positions)
- Breakout entry confirmation
- Limit order placement
2. Active Trade Management
Stop Loss Management
- Break-even move (after 1:1 risk-reward)
- Trailing stop implementation
- Partial position protection
- Time-based stop adjustment
Position Scaling
- Adding to winning positions
- Partial profit taking
- Risk reduction techniques
- Pyramid trading strategy
3. Exit Strategies
Technical Exits
- Price action reversal signals
- Target level reached
- Trend line breaks
- Volume analysis
Time-Based Exits
- Session close approaching
- Time target reached
- News event protection
- Weekend position management
Advanced Trade Management Techniques
Scaling Strategies
Scale-In Methods
- 1/3 position at initial entry
- 1/3 after break-even reached
- 1/3 at trend confirmation
- Risk adjustment per scale-in
Scale-Out Methods
- 1/3 at first target (1:1)
- 1/3 at second target (2:1)
- 1/3 at final target (3:1+)
- Trail stop on remainder
Trade Monitoring
Key Indicators
- Volume profile analysis
- Market depth changes
- Price action patterns
- Momentum indicators
Warning Signs
- Momentum divergence
- Volume divergence
- Pattern failures
- Time decay analysis
Trade Documentation
Pre-Trade Analysis
- Market context
- Zone identification
- Entry triggers
- Risk parameters
- Expected scenarios
During Trade
- Price action notes
- Management decisions
- Adjustment reasons
- Market changes
- Emotional state
Post-Trade Review
- Entry accuracy
- Management effectiveness
- Exit timing
- Lessons learned
- Improvement areas
8. Daily Trading Routine
Morning Preparation (1 Hour Before Market Open)
- 1
Analyze higher timeframe charts
Review daily and weekly charts for major zones
- 2
Identify potential supply/demand zones
Mark key levels on your charts
- 3
Create watchlist of instruments
Focus on instruments with clear setups
- 4
Review economic calendar
Note important news events
- 5
Check overall market sentiment
Understand broader market context
Daily Trading Goals
Minimum
1 Trade
High-quality trade per day
Maximum
3 Trades
Maximum trades per day
Focus
Quality > Quantity
Prioritize trade quality
9. Practical Exercises
Exercise 1: Zone Identification Mastery
Zone Identification
Master the fundamentals of supply and demand zones
Skills You'll Learn:
- Chart Navigation
- Price Action Basics
- Zone Recognition
Multi-Timeframe Analysis
Connect different timeframes for better trading decisions
Skills You'll Learn:
- Market Context
- Timeframe Correlation
- Advanced Analysis
Advanced Pattern Recognition
Master complex setups and advanced trading patterns
Advanced Skills:
- Complex Pattern Recognition
- Volume Analysis
- Advanced Trade Management
Master Levels
Coming SoonExpert-level trading techniques coming soon
Upcoming Advanced Topics:
- Level 4: Market Psychology
- Level 5: Professional Trading
Conclusion
Mastering supply and demand requires consistent practice, emotional discipline, and continuous learning. Remember that no strategy guarantees success, and continuous education is key.
Recommended Next Steps
- →Practice on demo account
- →Keep a detailed trading journal
- →Continuously refine your approach
- →Stay updated with market dynamics
Warning
Trading involves significant risk. Always use proper risk management and never risk more than you can afford to lose.